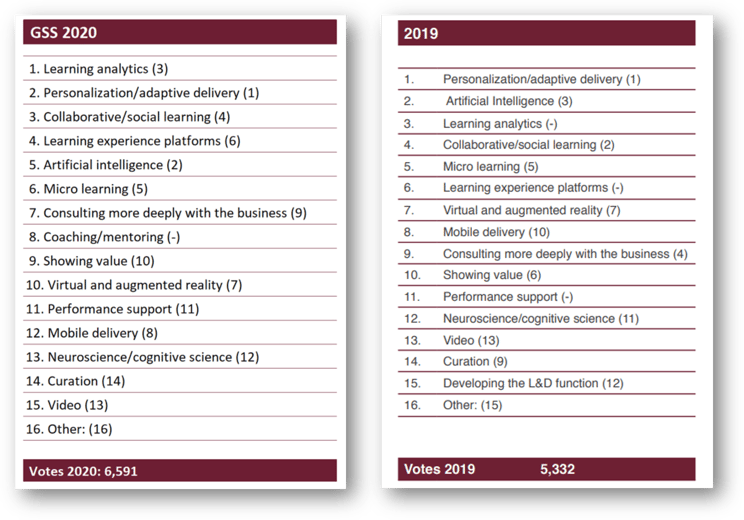
Data came out as a clear winner in the 2019 Global Sentiment Survey with Personalisation/adaptive delivery in first place and Artificial intelligence (AI) at second place and Learning analytics in third. Logicearth was pleased to see that it's not merely the abstract notion of 'data' but instead its practical application to inform action.
THE USE OF DATA
Now in 2020, we can see that trend developing. This year, we see that trend toward automation mature with Learning Analytics and Adaptive Delivery being joined with Collaborative / Social Learning. Logicearth reads this as a move toward fully-digital blended learning - where opportunities for social learning (human-to-human) interactions are enriched by the analytics available to facilitators and content served to learners by adaptive intelligent content systems (LXP's).
The action informed by data is the targeted response of L&D teams to curate and promote content using intelligent LXP’s like Percipio and using the rich data of systems like Verify to enable facilitators to tailor their classroom content to the specific needs of each group. Below we give a brief overview of some of the tools we have to support this smarter approach to talent development at scale.
Global sentiment survey results
 Image source: the Global Sentiment Survey*
Download the latest Global Sentiment Survey from our Industry Research page.
what we learnt last year
Personalisation/adaptive delivery comes out first with Artificial intelligence (AI) at second place and Learning analytics in third. Artificial Intelligence is the tool that powers both personalisation and adaptive delivery. Learning content and user interfaces can be specific to each individual. Also the curation of content can be automated to adapt to the needs of every individual.
As with our digital services at home, AI helps tailor recommendations to suit our preferences and needs. In corporate learning environments, AI will also consider the needs of the organisation. So both personal learning journeys and corporate communications (e.g. product launches and policy) can be delivered to workers.
Learning Analytics was a new option for respondents in the 2019 survey and came in straight away at third place. In 2020 it moves right up to the lead position as #1. This represents a shift in how Learning & Development describe our value to the organisations we support.
Traditionally we track volume: the number of classroom sessions or online courses completed. While Learning Analytics can still include those figures, it takes a more holistic view and draws in data from performance metrics across the organisation. Now we report on the impact our activity has on business performance. Read more about how L&D proves its value with executive dashboards in our blog 'What CEOs really want from L&D'.
practical applications
Logicearth is delighted to see how well this aligns with our product strategy across some of our key products for example:
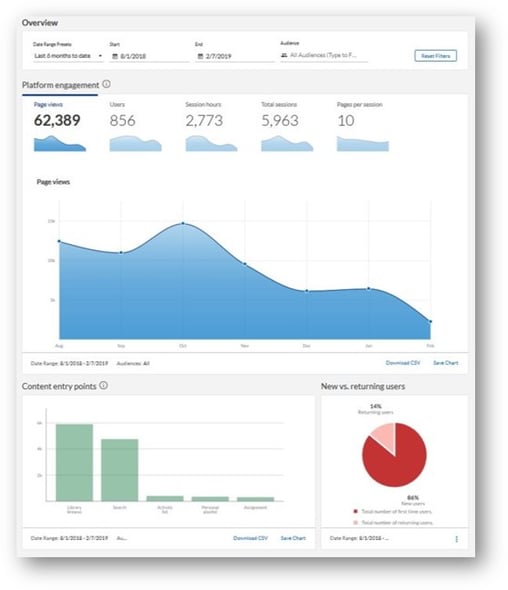
learningCloud is our Learning Experience Platform. Its rich visual interface makes it popular with learners, but what about managers? learningCloud provides actionable dashboards that empower managers to monitor the activity of learners on the platform.
This insight informs immediate action - either reaching out to staff through in-built messaging tools or quickly updating content through the easy authoring tool - to make an instant, positive impact.
View of learningCloud dashboard
Later this year, learningCloud will integrate with Power BI (Microsoft’s Business Intelligence platform) to build powerful real-time data visualizations and dashboards to map learning results to business goals.
We’re very excited about our new agile, adaptive microlearning service, Verify. Based on the OttoLearn platform, Verify combines so many of the best bits in digital learning today. It uses smart AI systems and learning algorithms to devise truly adaptive programmes.
It automatically deploys well-crafted bite-sized learning elements to create an engaging personal learning environment suited to today’s learning styles. It utilises spaced repetition for knowledge retention (read more about spaced repetition in this blog). The sophisticated business dashboards generated - integrated with Power BI - are a million miles away from the complete/pass/fail era of traditional Learning Management System reporting.
Visual report from Verify
Behind this whole solution is data. Advanced, sophisticated and complex, we can at last use this data for practical purposes that will really impact the effectiveness of L&D and improve learning within organisations.
Percipio is a learning platform that delivers an immersive and personalised learner experience combined with exceptional learning analytics. It is loaded with a rich off-the-shelf content catalogue. The content, which spans Leadership and Business Skills to IT Certifications and Data Analysis, leverages multi-modal learning content curated into over 500 channels.
The channels are continuously updated to ensure learners always have access to the latest information. Adaptive algorithms allow the platform to recommend where to start learning and guide learners through personalised learning paths. Content suggestions make it easier for learners to discover useful information that aligns with their interests.
The learning process is improved by allowing organisations to target specific needs and answer learner questions, all in one place.
The analytics and reporting functionality within Percipio shows how learning activities support key business objectives and quantifies program value through data visualisations. The out-of-the-box dashboards are unparalleled in quality and depth of data. This platform is built for the modern data-driven learning organisation which values the importance of data and the benefit of its analysis.

The future
L&D is changing. The rich data produced by digital learning platforms empowers us to be more targeted both as learners - adaptive platforms give us the content we need when we need it - and as L&D teams - where we analyze this data to inform precise and impactful actions.
We have greater insight into the activity of the workforce and are using data to inform the design of our programmes and how we target their delivery. We are using AI engines to automate the distribution of the right content at the right time. It's a seismic shift in how we operate and an exciting time to be in this profession.
To download the full Global Sentiment Survey head to our Industry Research page. 


Was this article helpful?